How to fill and read the cost matrix
In the next few lines, we will explain how to fill and read the Prevision.io Cost Matrix. We will go through a marketing use case to get an understanding of this notion.
User Story
Let’s imagine you work for the marketing division of your company. You would like to predict which clients will churn, giving some characteristics. To solve this problem, you trained classification models thanks to Prevision.io Studio. You have selected some models, for which the technical metrics seem good. Now, what about the business value ?
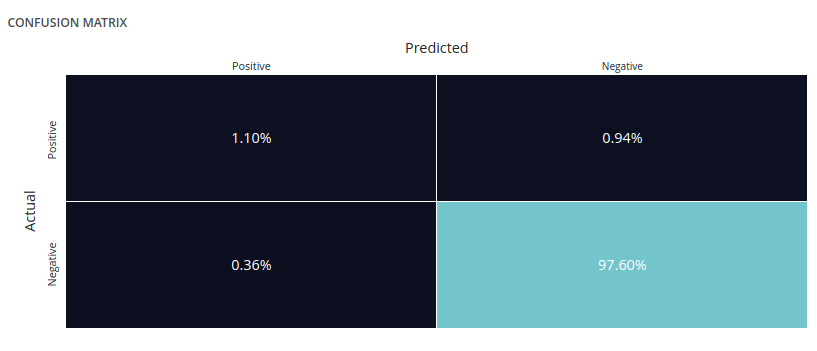
Classification outcome & Confusion matrix
This classification model has four different outcomes :
- the model correctly predicts that a client will churn (True Positive)
- the model incorrectly predicts that a client will churn (False Positive)
- the model correctly predicts that a client will not churn (True Negative)
- the model incorrectly predicts that a client will not churn (False Negative)
Considering these possibilities, we can calculate the associated rates (TP rate, FP rate etc) and put them in a matrix :
- TP rate = number of True Positive / number of Positive
- FP rate = number of False Positive / number of Negative
- TN rate = number of True Negative / number of Negative
- FN rate = number of False Negative / number of Positive
Profit modeling
For now, we only spoke about the quality of a prediction in terms of machine learning metrics. The end goal of a model is its monetary value. Providing you can estimate the gain/loss for the four classification outcomes, Prevision.io offers you the possibility to evaluate the monetary value of a prediction.
Let’s try to associate each outcome with a number.
- False negative (FN) means churner prediction of the model is wrong, and the enterprises do not have earning compared with non-application the model
-> Gain = 0€
- False positive (FP) means churner is forecasted as a non-churner. Customer churn prediction is going to provide decision support for subsequent customer retention, so it will bring unnecessary retention costs, let’s say 50€
-> Gain = -50€
- True positive (TP) means the model predicts the churner correctly, and the corresponding profit is defined as the customer’s customer value minus retention costs. For simplicity, all customers have the same value, let’s say 500€
-> Gain = 500 - 50 = 450€
- True negative (TN) means the model predicts the non-churner correctly, and it does not generate profit for the enterprises
-> Gain = 0€
Monetary value of predictions
We can now fill up the cost matrix with these values :
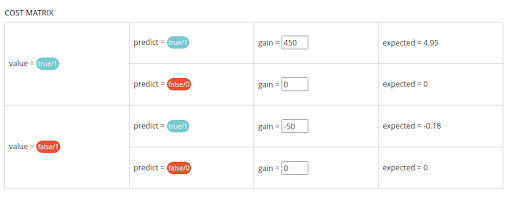
The expected value is given by gain multiply by outcome rate : TP rate = 1.10 % TP gain = 450 € -> expected = 4.95 €
Finally, the expected values are add up to calculate the expected gain for one prediction
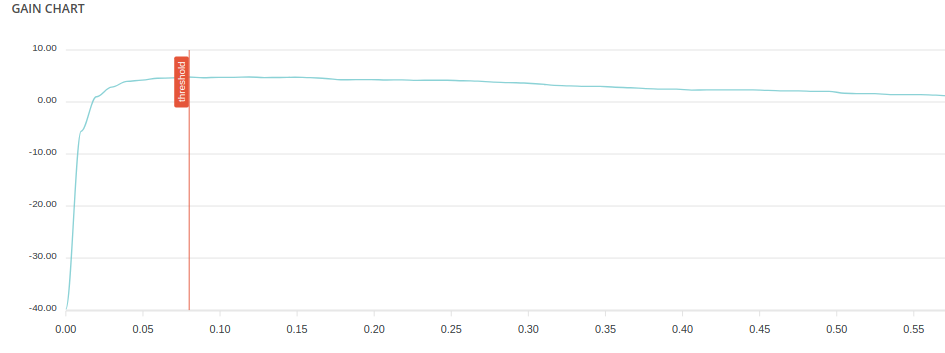
Profit maximization
In a classification model, outcomes rates depend on a threshold. A given model calculates for each individual a score, and the comparison between this score and the selected threshold determines the predicted value. So changing the threshold will change the outcomes rates, which will modify the monetary value of a prediction :


Using Prevision.io Gain Chart, you can choose the threshold which maximizes the profit for one prediction using this model :